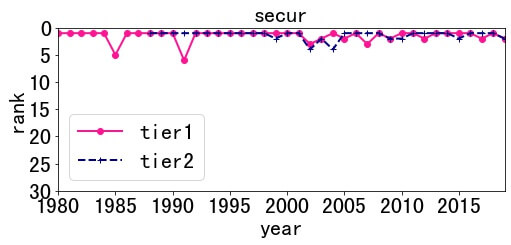
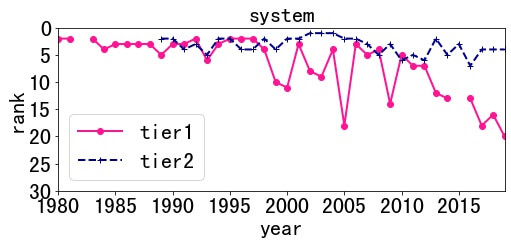
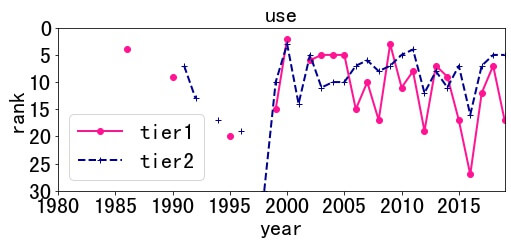
Following are comparison charts between tier1 and tier2 conferences. Click checkboxs to see figures.
A data-driven analysis on 17,797 security paper from 1980 to 2020.


A data-driven analysis on 17,797 security paper from 1980 to 2020.
Following are comparison charts between tier1 and tier2 conferences. Click checkboxs to see figures.


